Get Team buy-in to successfully adopt/follow Project Metrics
Project Metrics:Effort and Scheduled variances
As you start to work as a Project manager, your duties include monitoring your project metrics. How your project performs is a key indication of tracking success or failure in which case corrective measures are applied early. Though there are several of these metrics we focus on two key ones. Project metrics is a tool monitored and defined in the Project Management process flow.
Effort Variance

Scheduled Variance
Definition: Any difference between the scheduled completion of an activity and the actual completion is known as Schedule Variance.
Schedule variance = ((Actual calendar days – Planned calendar days) + Start variance)/ Planned calendar days x 100
Effort Variance
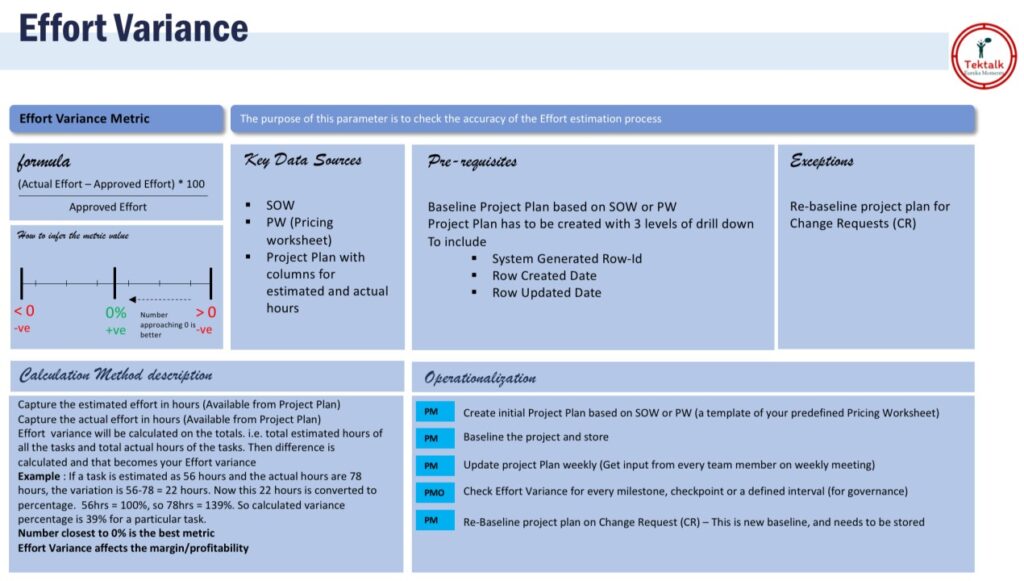
Effort Variance: The difference between the planned outlined effort and the effort required to actually undertake the task is called Effort variance.
Effort variance = (Actual Effort – Planned Effort)/ Planned Effort x 100
The slide at the top of this article explains very clearly the method put up in a manner easily understood by every team member. You can get them involved by asking them to develop similar slides for Scheduled Variance, Productivity, etc.,
A key function of project managers is making the team understand the importance of these Key metrics and how it affects the overall project. From experience, I’ve noticed that my team of programmers and systems analysts are not interested in ‘Management Subjects’ and would rather focus on design and programming. Explaining these metrics is not easy and one of the suggestion is to present slides that is easy to consume. A picture is worth a hundred words! An example of how to showcase it and visually help your team members remember and adopt it as part of their regular work and understand the importance to the over health of the project.
You can adopt this method further when applying it to SCRUM by showing what a sprint effort variance is for, there are several other infographics available.
Whatever the method you want to use it for, the way it is calculated remains the same. There have been several cases where there is a discrepancy in what value to use for an actual effort in a sprint based on the number of stories you have. There will be discussions and discrepancies, but it is all healthy as your team is now participating in a discussion and ultimately understanding the importance. Ultimately, this is the purpose of any project metrics as it is supposed to help the team stay involved for the success of the project! Teltalk has now moved on to ScrumByte.
Authored by Vijay Chander – All rights Reserved 2022

